
Red Line Burndown for Jira
Your plan.
Meet reality.
Compare your plan with actual progress. Forecast completion
and understand what changed, right inside Jira.
Jira Cloud Supports new and classic Jira dashboards
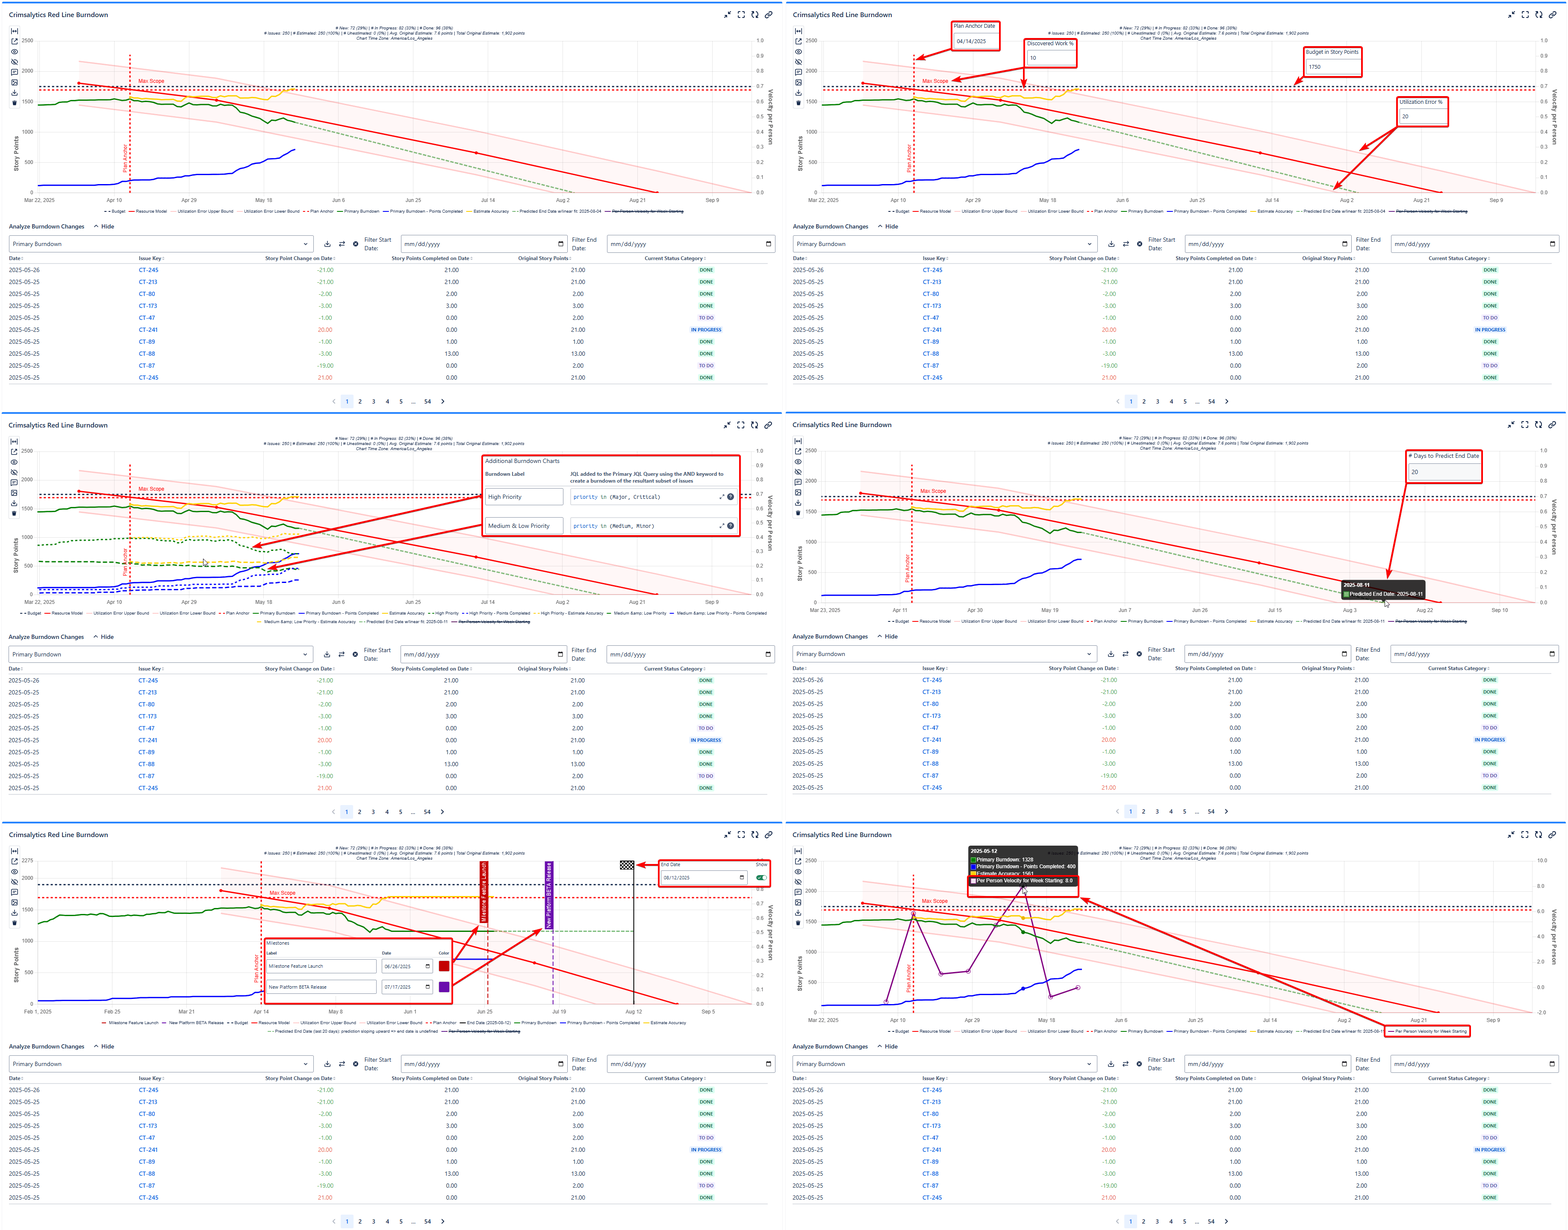
Model capacity
A realistic plan for the team
and time you actually have.
Forecast completion
See where your current
progress is taking you.
Trace scope changes
Understand the issue changes
behind the bigger picture.
01 / Plan with capacity
A deadline isn’t
a resource plan.
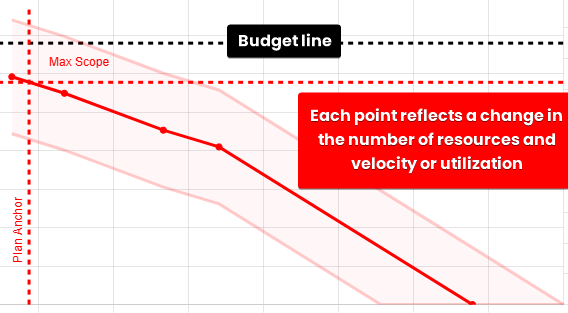
Give your project a Red Line: a capacity model based on your team’s availability, velocity, or utilization. See how the work ahead compares with the plan you set.
- Account for changes in staffing and availability
- Allow for discovered work and estimation uncertainty
- Compare progress with your original assumptions
02 / Track the whole picture
One project.
More perspective.
Follow the overall burndown alongside the teams, priorities, or features that contribute to it. Use Jira filters or JQL to define the work that matters.
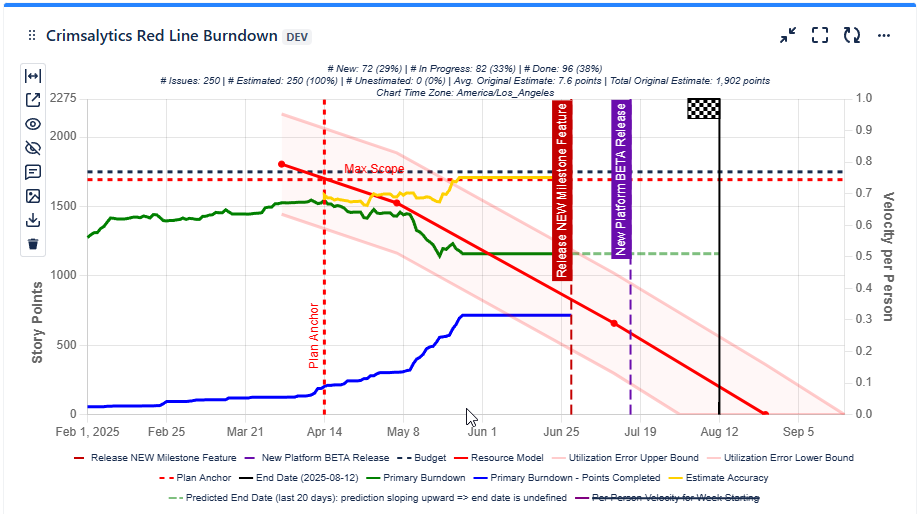
Multiple burndowns
Track subsets of your project without losing sight of the overall scope.
Milestones that matter
Mark key dates directly on your chart to keep stakeholders aligned.
Your way of estimating
Work in story points or time, with weekly velocity or utilization.
03 / Understand what changed
Every spike
has a story.
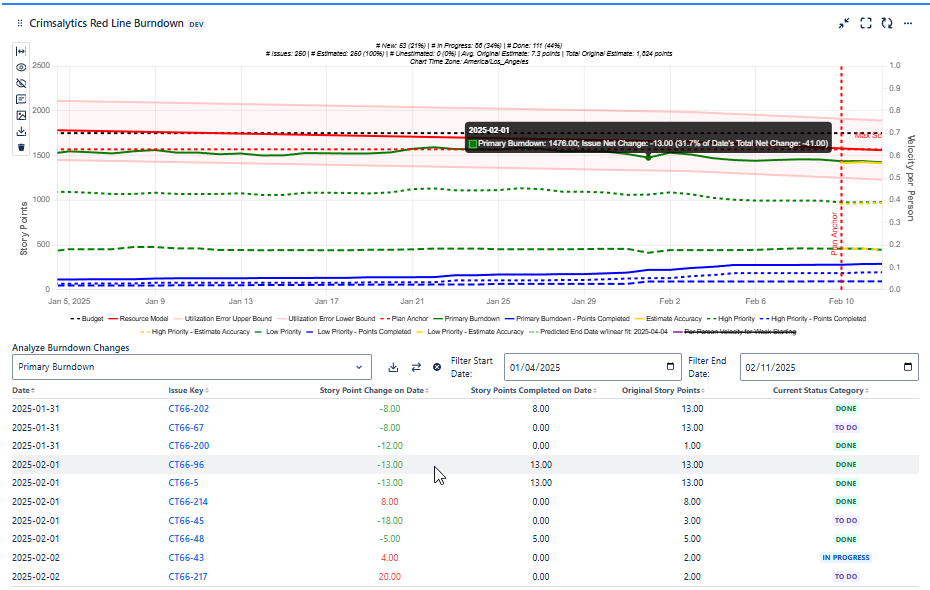
New scope? A revised estimate? Completed work? Stop piecing together the explanation. Explore issue-level changes alongside your burndown.
- Sort changes to find the biggest contributors
- Filter by date or the chart’s visible range
- Select a row to highlight its point on the chart
From Jira data to a clearer plan
Your next project review
starts here.
-
01
Choose your work
Add Red Line Burndown to a new or classic Jira dashboard. Choose the Jira issues you want to track.
-
02
Set your plan
Choose story points or time tracking. Define your resource model, budget, and important milestones.
-
03
See the full picture
Compare the plan with actual progress, review projected completion, and investigate scope changes.

At home in your workflow
Built for Jira.
Runs on Atlassian.
Hosted on Atlassian, with app data stored within Atlassian. Bring planning and progress into the dashboard your team already uses.
More about data and privacyClarity changes the conversation
Make your next move
with the full picture.
Get Red Line Burndown for Jira
Want a hand getting started? Book a complimentary 30-minute setup session